")


If I told you that NASA has developed a radical new way of monitoring and quantifying your workouts, and that that method outperforms all others, you’d probably assume that it involves bleeding-edge science. There would be AI, and some sort of wearable or perhaps even injectable technology. It would be very expensive.
But you’d be wrong, for reasons that tell us something important about the quest to transform training optimization from an art into a science. A new study by Mattia D’Alleva and his colleagues at the University of Udine compares different ways of assessing the “training load” of different workouts—and finds that a low-tech NASA questionnaire produces the most accurate results. The findings offer a reminder that outsourcing our training decisions to wearable tech algorithms doesn’t always outperform simply listening to our bodies. The research also raises a tricky question: is the workout that makes you most tired also the one that increases your fitness the most?
Why Does Training Load Matter?
The goal of training is to impose a stress—a training load—on your body that makes it tired in the short term but triggers adaptations that make it fitter in the long term. Going all-out in one workout isn’t constructive, even though it imposes a huge training load, because it leaves you too tired to train effectively the next day. The art of training is figuring out what mix of easy, medium, and hard workouts will enable you to accumulate the greatest possible training load over weeks and months without getting crippled by fatigue.
In its simplest form (as I discussed here), the training load of a workout is a combination of how hard you push and how long you push for. But the details get tricky. What’s the best measure for how hard you’re pushing? You could use pace, power, heart rate, heart rate variability, lactate levels, perceived effort, or other progressively more esoteric metrics. And how do you combine effort with duration? You can’t just multiply them together, because effort is nonlinear: running twice as fast for half the distance won’t produce the same training effect.
The new study, which is published in the International Journal of Sports Physiology and Performance, compares seven different ways of calculating training load. Four of them are variations on a concept known as TRIMP, which is short for “training impulse” and is based on heart rate measurements, using equations that account for lactate levels, breathing thresholds, and other details. A fifth uses heart-rate variability, and a sixth uses a subjective rating of effort. (Most fitness wearables, by the way, likely use a combination of the above methods, though their exact algorithms are typically proprietary.) The seventh method is the NASA questionnaire, which we’ll come back to.
The gold standard against which all these methods were compared is the “acute performance decrement,” or APD. Basically, you do an all-out time trial, then you do your workout, then you do another all-out time trial. Your APD is how much slower the second time-trial is compared to the first one, as a measure of how much the workout took out of you. Obviously this isn’t a practical way of monitoring training, because you can’t race before and after every workout. But for researchers, it’s a way of checking whether various methods—including the seven they tested in this study— correspond to the reality of how hard a workout is on your body. At the end, they were able to figure out which method was the most reliable predictor of training load.
What the New Study Found
D’Alleva and his colleagues recruited 12 well-trained runners (10 men and 2 women) to test four different running workouts on different days:
- Low-intensity training (LIT): 60 minutes at a pre-determined comfortable pace
- Medium intensity (MIT): 2 x 12:00 at a moderate pace with 4:00 easy recovery
- Long high-intensity (HITlong): 5 x 3:00 hard with 2:00 recovery
- Short high-intensity (HITshort): two sets of 11 x 30 seconds hard, 30 seconds easy
The performance test was running at VO2 max pace until exhaustion. When they were fresh, the runners lasted just under six minutes on average. After the one-hour easy run, their APD was 20.7 percent, meaning they gave up 20.7 percent earlier in the post-workout VO2 max run. After the medium-intensity run, the APD was 30.6 percent; after the long intervals, it was 35.9 percent; after the short intervals, it was 29.8 percent.
So how well were each of the seven training load calculations able to predict this APD? The short answer is: not very well. Here’s a comparison of APD (on the left) and one of the parameters studied, which is called bTRIMP and is based on heart-rate measurements and lactate curves:
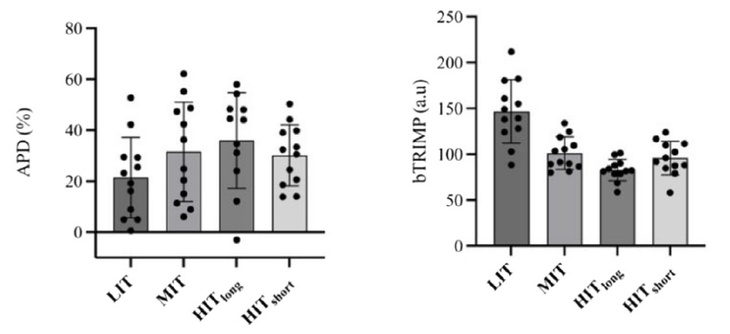
In fact, the relationships are completely reversed: the easiest workout according to bTRIMP produces the biggest APD in reality, and the workout ranked hardest by bTRIMP produces the smallest APD. All except two of the training load calculations the researchers measured have similar upside-down relationships. The two exceptions are heart-rate variability and the NASA questionnaire, which look like this:
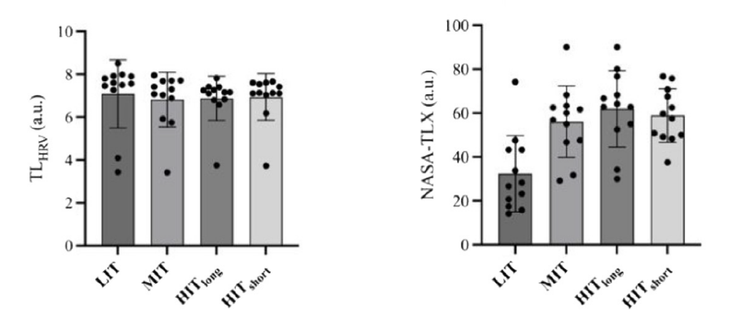
The heart-rate variability measures, on the left, don’t tell us much, because they’re basically the same after each of the four workouts. (You can see some subtle differences, but they’re not statistically significant.) The NASA questionnaire, on the other hand, bears a striking resemblance to the APD data, and the statistical analysis confirms that it’s a good predictor. In other words, it’s the only one of the seven calculations tested that, according to this study, accurately reflects how exhausted you are after a workout.
So what is this questionnaire? It’s called the NASA Task Load Index, or NASA-TLX, and was developed in the 1980s. It’s simply a set of six questions that ask you to rate the mental demand, physical demand, temporal demand (how rushed were you?), performance (how well did you do?), effort, and frustration of a task. You answer each of these questions on a scale of 1 to 100, then the six scores are averaged—and presto, you have a better measure of how hard your workout was than your watch or heart-rate monitor can provide.
What the NASA Questionnaire Misses
These results don’t mean that we should all start recording NASA-TLX scores in our training logs. Questions like how hurried you felt don’t seem very relevant to running, or to training in general. What’s more significant about the questionnaire is what it doesn’t include: any measure of how long the workout was.
All the other training load measures rely on a combination of intensity and duration. But the effect of duration swamps the measurement: that’s why the bTRIMP graph above shows the 60-minute easy run (LIT) as the workout with the biggest training load. It’s really just telling us that it was the longest workout. The NASA-TLX, on the other hand, just asks (in various ways) how hard the workout felt once it was done. That turns out to be a better way of predicting how much slower you’ll be after the workout.
There’s an implicit assumption in all of this discussion, though, which is that the workout that provides the biggest training load is the one that will improve your fitness the most. Is APD—how much slower you get over the course of a single workout—really the best predictor of fitness gains? It’s easy to come up with scenarios where that’s not true. If I sprain my ankle, my APD will be enormous, but that doesn’t mean I’m going to be an Olympic champion next month. Similarly, you can imagine workouts that would inflict a disproportionate amount of performance-sapping fatigue—steep downhill running, for example—compared to their fitness benefits.
Perhaps what we’re seeing here is not so much “good” (NASA-TLX) and “bad” (TRIMP) measures of training load, but rather good measurements for two different types of training load. The APD and NASA-TLX mostly reflect how hard/intense/fast the workout was. TRIMPs and other metrics that incorporate duration end up mostly reflecting how long the workout was. There’s no reason to assume that these two parameters are interchangeable. It’s not just that you can’t get the same training benefit by going twice as fast for half as long. It’s that there’s no equation that makes fast running produce the same benefits as slow running. They’re two different physiological stimuli, and the smart money says you need both to maximize your performance.
So where does this leave us? I’m not anti-data, and I’m open to the idea that some of the newer metrics provided by wearable tech might reveal useful patterns if you collect them consistently. But if you strip training down to its bare essentials, these results suggest to me that there are two separate parameters that really matter: how long and how hard. And for now, I’m not convinced that we have any measuring tools that are significantly better than a stopwatch and an honest answer to the question “How did that feel?”
For more Sweat Science, join me on Threads and Facebook, sign up for the email newsletter, and check out my new book The Explorer’s Gene: Why We Seek Big Challenges, New Flavors, and the Blank Spots on the Map.
The post Wearable Tech is Good. But Listening to Your Body Is Still Better. appeared first on Outside Online.