
Back in 2019, scientists proposed a new theory of endurance. For efforts lasting more than about a day, they suggested, the ultimate limit is dictated by how much food you’re able to digest. Your heart and mind and muscles can adapt to do amazing things, but they all need fuel. The most calories you can digest seems to be about 2.5 times your resting metabolism—so that’s what limits how much physical activity you can do day after day over weeks, months, or years.
This idea of a “metabolic ceiling” sparked lots of discussion, but it also left some open questions. Does it really apply to top-level endurance athletes—like, say, Kilian Jornet, who just finished climbing 72 1,400-foot summits and cycling 2,500 miles in just 31 days while quaffing olive oil for calories? A newly published study in Current Biology sets out to answer some of these questions, measuring calorie data from 14 world-class ultrarunners and triathletes and analyzing the training logs of notable athletes like Jornet. Here’s what they found.
What They Did
The study was led by Andrew Best of the Massachusetts College of Liberal Arts and Herman Pontzer of Duke University, the latter of whom was one of the key authors of the original 2019 paper. The key data in the paper comes from 14 ultra-endurance athletes who drank special isotope-labeled water that enabled the scientists to calculate exactly how many calories they were burning at different times. They collected this data during events like a six-day ultramarathon, a 24-hour record attempt, and Joe McConaughy’s 13-day FKT on the Arizona Trail. They also collected calorie data during one or more training weeks, for reasons we’ll get into below.
The calorie data from races blew through the theorical limit of 2.5 times resting metabolism. That’s because you can afford to go into calorie debt for short periods of time, meaning that you’re burning stored fat (and sometimes muscle) and losing weight. “Joe lost tons of weight running the Arizona Trail,” Best told me. But that can’t continue indefinitely. If you’re burning 9,000 calories a day (as Jornet estimates he was during his most recent challenge) but only consuming 7,000 calories a day, you might be able to keep doing that for a month or two, but you’ll eventually hit a wall.
That’s why Best also measured calories during training weeks. By taking at least two measurements for each runner, one during a competition or hard training week and the other during a relatively easy training week, he created a personalized formula for each runner to estimate how many calories they burn as a function of how much they’re running. Then he applied this formula to a year’s worth of training data to see how many calories they could burn over a 12-month period rather than just during a week or two of competition. That’s where the 2.5 resting metabolism limit shows up again.
Here’s a graph showing “metabolic scope” (which is how many calories per day you’re burning expressed as a multiple of resting metabolism) for different durations:
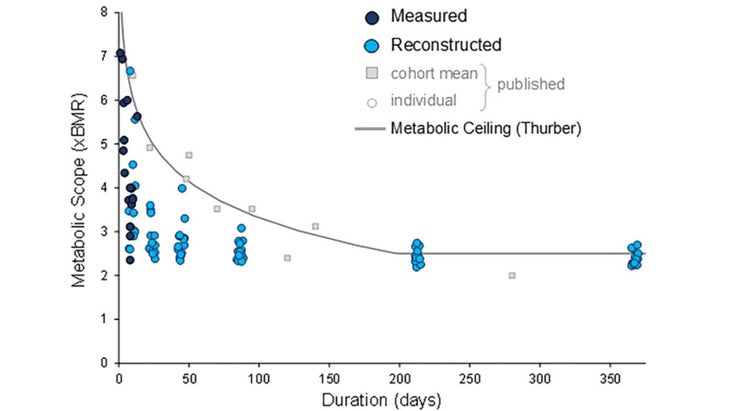
The dark blue circles on the left side of the graph show the direct measurements of calorie burn during training and racing. There are values as high as seven times resting metabolism, which corresponds to a one-day record attempt on a 90-mile trail.
The light blue circles are calculated from the athletes’ training logs based on training periods of various lengths. For example, at the six-week mark (42 days), you can see a range of light blue circles between about 2.5 and 4. The circle at 4 corresponds to a runner who ran an astounding 1,989 miles over a six-week period, which is 332 miles per week. But that was during a 46-day FKT attempt on the Appalachian Trail, so clearly not a level the subject could sustain for an entire year.
As you extend to longer durations like 30 or 52 weeks, you can see that the light blue circles all cluster around 2.5. Some are a little higher, others a little lower, but none of these elite ultra athletes are sustaining values that are significantly higher than the proposed limit.
What about true super-elites like Kilian Jornet and triathlon star Kristian Blummenfelt? Based on their publicly available training data, along with the training hours-to-calories formula that the new study generated, Best estimates that Blummenfelt averages about 2.8 to 2.9 times his resting metabolism over the course of an entire year, while Jornet hits 2.75. So the best of the best may edge slightly above the usual limit of 2.5, but not by much.
What It Means
There are two interesting features in the graph I included above. The first and most important is the flat line on the right side of the graph, which corresponds to the proposed asymptote of 2.5 based on the limits of digestion. The new results bolster my confidence that this really is a consistent phenomenon. If Jornet isn’t breaking it (by much), I don’t know who is. So I was surprised, when I checked in with Herman Pontzer, to find that he’s less confident than he was in 2019 that this is an ironclad rule.
One of his reasons is that more data has emerged from elite cyclists at Grand Tours where they seem to be burning enormous numbers of calories without losing weight—which implies that they’re absorbing a comparable number of calories. A study of seven cyclists in the Giro d’Italia, for example, found that they burned more than four times their resting metabolism over the course of 24 days without losing weight. It may be that sports scientists’ quest to produce ever-more digestible carbohydrates is enabling cyclists to push back the limits of digestibility.
The other interesting feature in the graph is the shape of the curve on the left. You see a similar curve when you plot your speed in shorter distance (i.e. a few hours or less) races against the time elapsed, as I did for my own track times here. In that situation, the asymptote corresponds to a quantity called critical speed, which represents your long-term sustainable pace. The shape of the curve is dictated by another parameter sometimes referred to as anaerobic capacity, which you can think of (very loosely) as the amount of energy you’re able to “borrow” when running faster than critical speed before you hit a wall. Milers and other middle-distance runners tend to have a very high anaerobic capacity.
Something has to dictate the shape of Pontzer’s multi-day energy curve, and at this point he’s not sure what that something is. Intuitively, you can think of it as analogous to anaerobic capacity: you can “borrow” a lot of calories for a short period of time, putting you way above the 2.5 line; or you can borrow a lesser amount over an extended period of time. If you want to keep going for, say, six months, you can’t really borrow anything: calories out has to be balanced by calories in.
But what determines the shape of that curve? If you’re carrying a lot of body fat, does that enable you to borrow more for longer? Or, more likely, if you’ve trained your metabolism to burn fat more rapidly, does that raise the curve? Does the precise shape of the curve depend on the mix of fat and carbohydrate that you burn at different exercise intensities? Or are there other non-metabolic factors that come into play, like muscle recovery or mental fatigue? The physiology of multi-day endurance challenges is still a relatively young scientific field—which means there should be lots of more insights, and lots more fun, still to come.
For more Sweat Science, join me on Threads and Facebook, sign up for the email newsletter, and check out my new book The Explorer’s Gene: Why We Seek Big Challenges, New Flavors, and the Blank Spots on the Map.
The post What Ultrarunners Teach Us About the Limits of Calorie-Burning appeared first on Outside Online.